
Clinical Trial Corner is a biweekly series from Dr. Vladimir Misik, founder of LongTaal and CSOFT’s VP of Global Clinical Strategy.
In the previous two-part Clinical Trial Corner miniseries, we provided a global assessment of patient diversity in industry CTs (iCTs) and highlighted several countries and regions that appear underrepresented in the development of new products relative to the consumption of prescription pharmaceuticals. In today’s post, I am going to discuss how a similar methodology can be utilized to assess the reputation of countries and regions among sponsors of iCTs.
Perception of countries’ performance in ongoing or recent trials plays a crucial role during the site and country selection process for newly planned iCTs. In many instances, inclusion or exclusion of sites in certain countries is based on the personal experience of the study manager and/or team responsible for the country and site selection process. The majority of large industry sponsors and large CROs have made significant efforts to make this process more objective and to utilize quantifiable past performance data of sites and countries as part of the country selection process (i.e., before deciding to include a county in a more detailed site feasibility assessment). As a result, countries with no prior recorded experience in a given indication are often automatically excluded, and vice versa.
The limitations of such approaches for optimal study planning are clear and very costly to the industry (1). They are either heavily biased by the personal experience of one or more individuals, and/or are limited to past performance in studies usually managed by one organization only, having no visibility into countries’ performance from other sponsors or CROs. The result of such biased selection processes is often the repeated inclusion of countries in studies with no remaining study patient population for trial inclusion. The consequence of one such biased country selection process was a recent super-saturation of sites in multiple (particularly smaller) Central and East European countries with Crohn’s disease and Ulcerative colitis studies (2), with cumulative recruitment targets exceeding trial-accessible patient populations in those countries.
We wanted to come up with a quantifiable method for assessing the reputation of countries among sponsors and CROs – i.e., to call out countries in which typical allocation rules do not appear to follow the “normal” allocation pattern.
For any for-profit organization, which the vast majority of industry sponsors of CTs are, “normal allocation” is one that optimizes return on investment (ROI); in this case, the investment being the R&D expenditures, returns of which are measured in terms of prescription sales. How are the two related? It is well known that exposure of the key opinion leaders (KOLs) and other future prescribers to the product during early phase (Phase 2 and 3) clinical trials is of critical importance for the commercial success of the product once launched (3) (4). Optimal ROI thus dictates allocating the highest share of global iCT budgets for recruitment of patients in future high-prescribers’ markets first. Therefore, a “normal” allocation pattern would be one where a country’s market share of iCTs sites (as a % of global) is similar to that country’s market share of global prescription sales. Regarding additional details about the methodology, let me refer you to our recent publication where these terms and the data sources and methodology are explained. (5)
As shown in Figure 1, for the vast majority of large pharmaceutical markets, the “normal allocation pattern of iCTs applies: their iCTs market share (% of global sites) resembles the prescription sales market share. By “resemblance”, we mean that for the majority of countries, iCT market share is somewhere between greater than ½ of the prescription sales market share and less than two times the prescription sales market share.
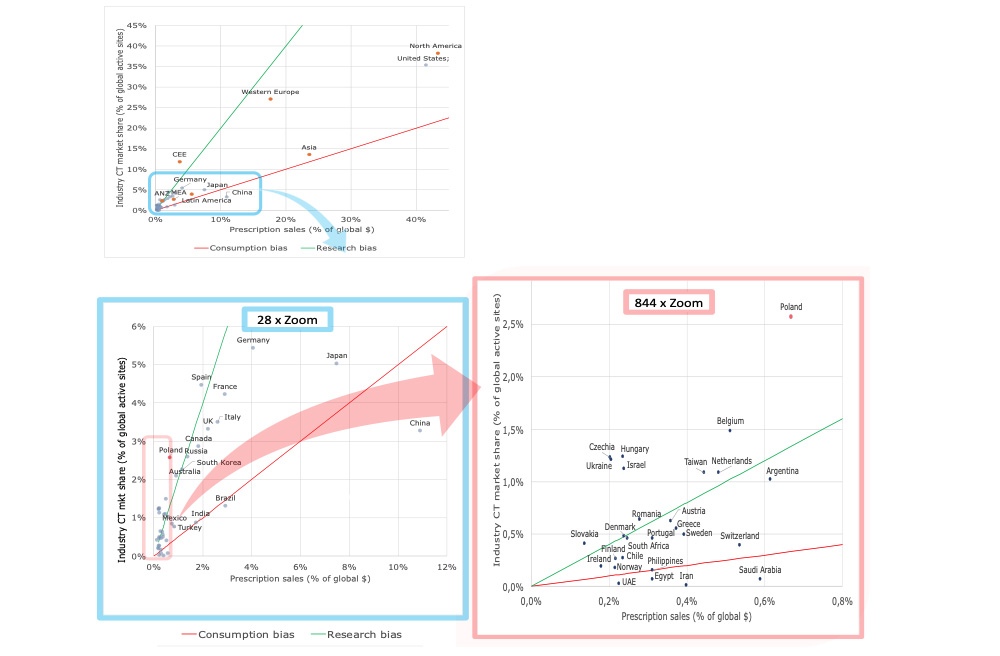
Figure 1. Relationship between share of prescription sales and industry CT market share. Regional view (Top panel) and expanded country-level views (Lower panel: 28x zoom and 844x zoom). Based on 2020 data by LongTaal. (2)
Thus, the “normal” allocation pattern can be described as:
iCTs market share = Prescription sales market share x R, where R ∈ ( 0.5; 2 )
The green line in Figure 1 delineates R = 2 and the red line R = 0.5.
We therefore postulate that any significant deviations from the “normal” pattern must be attributable to factors other than ROI, measured in terms of prescription sales returns. Since we can safely assume that profit-seeking companies are collectively behaving rationally, there must be other factors (let’s call them “Reputation”) which are driving an “out-of-normal” allocation pattern.
To assess this, we introduced a quantifiable measure of country’s reputation among sponsors of industry CTs – a so-called iCT Country Reputation Index (R), expressed as the country’s participation in development of novel pharmaceuticals (approximated as % of global iCT sites) relative to its consumption of marketed products (approximated as % of global sales):
R = Industry CT market share (% of global iCT sites) / Share of prescription sales (% of global sales)
Figure 2 shows graphical representation of the iCT Reputation Index by a group of countries around the globe, with several CEE countries and Israel ranking among countries enjoying the highest reputation among sponsors of CTs. On the other side of the scale are countries that are disproportionally underrepresented in the development of new products (you will find a list of these in our previous blog on this topic). These countries, the majority of which are from the Middle East and Africa, are suffering from lack of strong positive reputation among sponsors of iCTs.
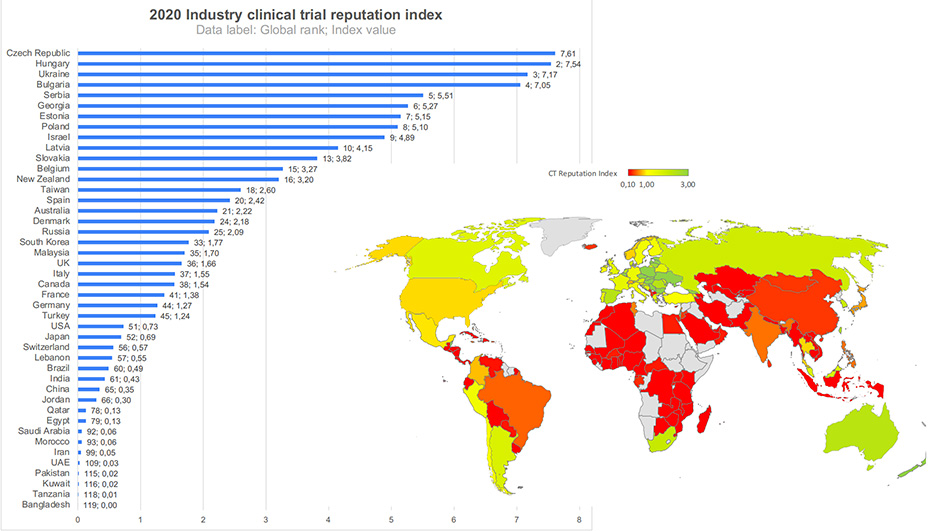
Figure 2. Figure 2. Industry CT reputation index = Industry CT market share/Pharma sales market share. 2020 data. Insert: CT Reputation index for selected countries. Data by LongTaal. (2)
Our data does not provide insights into the nature of the reputational components. However, it is safe to assume that it is a juxtaposition of various sponsors’ experiences or factors including but not limited to: study start-up duration, data quality and acceptability by the major regulatory bodies (US FDA and EMA in particular), cost per patient, availability of experienced investigators and CT sites, availability of monitoring staff in the country, complexity of the logistics of study supplies and biospecimen logistics, ease of travel to the country for quality management visits and inspections, personal safety (e.g. high crime rate), external study risks (such as war or civil unrest, e.g. Ukraine or Iran), sanctions (e.g. Iran, Russia), and so on.
In summary, given what are very costly delays of CT completion and/or study cancellations due to the inability to complete study recruitment targets, we strongly recommend supplementing sponsors’ in-house perception of countries’ performance and in-house historical performance databases with external country reputation data, summarizing collective countries’ allocation patterns among trial sponsors and CROs. Using such data can also be a potent business development tool for smaller countries with available patient pools and willing investigators, which are routinely bypassed by many sponsors and CROs due to lack of in-house evidence of their past performance (the so-called Catch 22 situation: how do sites in smaller emerging countries (e.g. Georgia) get included in new clinical trials if they have not participated in similar trials previously, and thus are automatically excluded by in-house allocation algorithms due to lack of experience?).
REFRENCES
- Huang GD, Bull J, McKee KJ, Mahon E, Harper B, Roberts JN; Clinical trials recruitment planning: A proposed framework from the Clinical Trials Transformation Initiative; Contemporary Clinical Trials 66 (2018) pp.74-79. https://www.sciencedirect.com/science/article/pii/S155171441730753X.
- LongTaal CT Informatics, data refreshed on October 16, 2022. [Online] https://longtaal.com/features/lt-analytics/.
- Moynihan CK, et al. Physicians’ Understanding of Clinical Trial Data in Professional Prescription Drug Promotion. J Am Board Fam Med: first published as 10.3122/jabfm.2018.04.170242 on 9 July 2018. Downloaded from http://www.jabfm.org/ on 31 December 2018. 9 July 2018, Vol. 31, 4, pp. 645-649.
- Lublóy A. Factors affecting the uptake of new medicines: a systematic literature review. BMC Health Services Research. 2014, Vol. 14, 469, pp. 1-25.
- Misik V, Jarosz B, Beckowski L, Czarnecka M, Dabrowski T, Drake D, Milowska K, Ziecik P, Magielski P, Szczepannik W: REPORT: Industry Clinical Trials in Poland. Possibilities to increase number and scope of trials in Poland. Publishers: INFARMA and POLCRO. December 2021; pp 1-115. [Online] https://www.infarma.pl/raporty/raporty-infarmy/raport-%E2%80%9Ekomercyjne-badania-kliniczne-w-polsce.-mozliwo%C5%9Bc-zwiekszania-liczby-i-zakresu-badan-klinicznych-w-polsce/.